November 5, 2025
Young Harris cultivates curious minds, preparing students to make meaningful contributions while embracing a vibrant campus life.
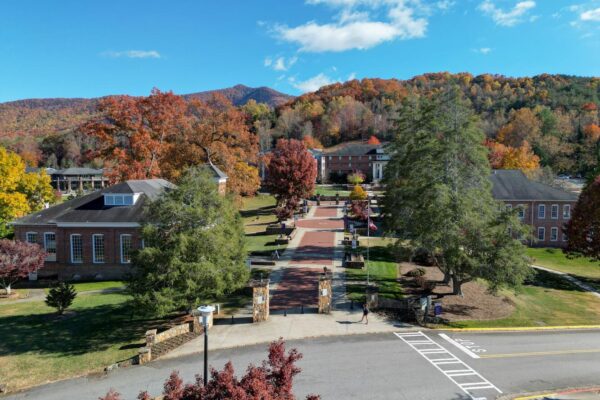
Rooted in tradition yet forward-thinking, Young Harris College is renowned for its liberal arts education, promoting intellectual curiosity and a holistic development of its students. Merging the natural beauty of the Blue Ridge Mountains with rigorous education, YHC offers a comprehensive blend of classroom, residential, and extracurricular experiences, ensuring well-rounded growth.
From our iconic landmarks to state-of-the-art facilities, Young Harris College is the perfect environment for your academic journey.
Find your way to Young Harris College in Georgia. We’re a two-hour drive from Atlanta, Asheville, and Chattanooga.
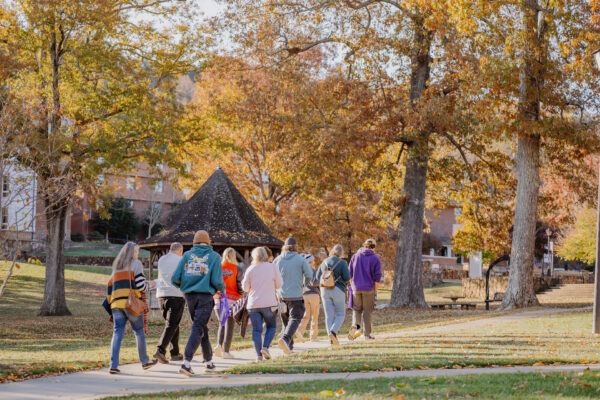
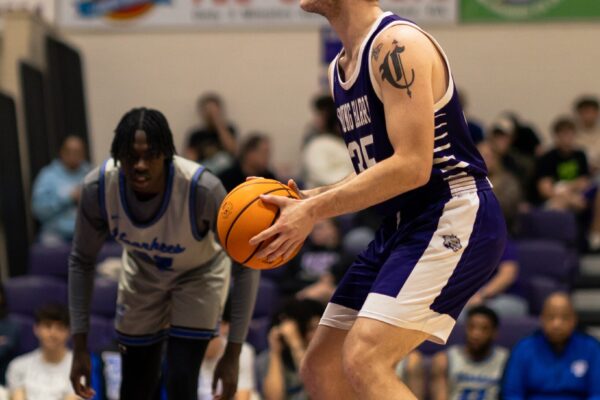
Get a sneak peek of what life as a Mountain Lion is all about through tours and special events.

At Young Harris College, our outcomes speak volumes. Through a combination of dedicated mentorship, rich academic experiences, and vibrant community involvement, our students consistently excel in their pursuits. Explore the tangible influence of a YHC education through retention and graduation rates as well as other success metrics.
of students are employed or in graduate school 6 months post graduation
of students receive scholarships/grants

Our mission and values center around building a warm-hearted community of learners, transforming lives into passion and purpose.
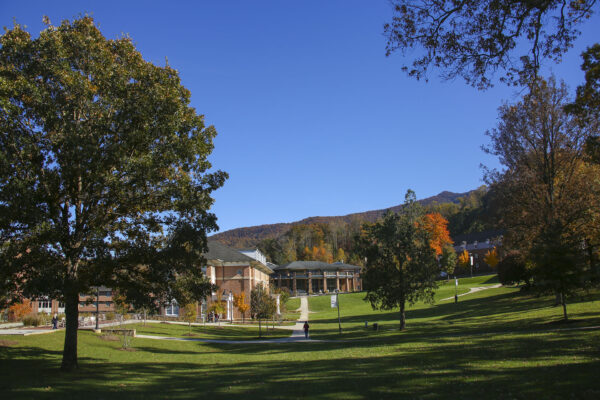
Embracing our position amidst the stunning Appalachian Mountains, Young Harris College is deeply committed to sustainable practices that honor both our immediate environment and the global community. We understand the integral role of education in cultivating a greener future, ensuring that every student leaves our gates with a heightened sense of ecological responsibility and the tools to make positive change.


Young Harris College is accredited by the Southern Association of Colleges and Schools Commission on Colleges (SACSCOC) to award baccalaureate and master’s degrees. Young Harris College also may offer credentials such as certificates and diplomas at approved degree levels. Questions about the accreditation of Young Harris College may be directed in writing to the Southern Association of Colleges and Schools Commission on Colleges at 1866 Southern Lane, Decatur, Georgia 30033-4097, by calling 404-679-4500, or by using information available on SACSCOC’s website (www.sacscoc.org).

Meet the visionary leaders driving our legacy forward.
Explore a vibrant backstory that spans nearly 140 years.
1 College Street
Young Harris, GA 30582
(800) 241-3754